The Schneider lab Platynereis dumerilii online database PdumBase , provides a comprehensive, versatile online tool to investigate stage specific transcriptional inputs during embryogenesis and during the life cycle of the annelid Platynereis dumerilii andf other selected species (e.g. Danio rerio, Xenopus tropicalis, Nematostella vectensis, Strongylocentrotus purpuratus).
This document provides a brief description of the database content and a detailed guide on how to browse its data thorough exemplary searches. The tutorial is intended as a motivational introduction while exploring and trying out the features PdumBase has to offer as an online resource to integrate and visualize our data and findings.
Download a PDF version of this manual here
Table of Content
- Section 1: Database Content
- 1. RNA-Seq Data Sets
- 2. Expression data
- 3. Annotation
- 4. Gene Expression Profiling
- 5. Coexpression Networks
- 6. Comparative Transcriptome Data
- Section 2: Tutorial Examples
- Downloading results from PdumBase
Section 1: Database Content
In the following, the database content as well as its structure is explained. First, the details of the raw RNA-Seq data sets are highlighted, followed by an introduction into their corresponding expression data and associated annotation profiles. Furthermore the gene expression profiling features of this software are introduced, followed by an introduction into Platynereis specific coexpression networks as well as their comparative transcriptome data.1. RNA-Seq data sets
Early stages data set:
RNA-seq data generated by Schneider lab. Description: This data corresponds to the first comprehensive transcriptome draft during early development in Platynereis dumerilii using the de novo assembly strategy. We performed mRNA deep sequencing of distinct stages using the Illumina HiSeq sequencing system with read lengths of 75bp to 100bp(H.-C Chou et al., 2016).
Time points: 2, 4, 6, 8, 10, 12, 14 hours post fertilization (hpf). Each stage has two biological replicates. The depth of these libraries ranges from 40 to 120 million paired-end reads (see table 1.)
Time points from Early Stages - data set |
Time (hpf) | Description | Time (hpf) | Description |
|---|---|---|---|
| 2 | Zygote | 10 | ~ 140-cell |
| 4 | ~ 8-cell | 12 | ~ 220-cell |
| 6 | ~ 30-cell | 14 | ~ 330-cell |
Assembly: All the biological replicates, which contain about 1.5 billion reads, were assembled into 357,961 transcripts in a genome independent manner. Due to alternative splicing events, out of the total transcripts assembled, 193,310 belong to genes.
Later stages data set:
RNA-seq data generated by Jekely lab. MPI for Developmental Biology, Tübingen, Germany (M. Conzelmann, et al., 2013).Description: In comparison with the earlier stages data, the later stages data set is of lower quality and lower sequencing depth.
Time points: This data set consist of 10 time points from 24 hours post fertilization to 3 months old adults. This set also includes female and male RNA-seq samples. There are no biological replicates (Table 2).
Time points from Later Stages - data set |
Time (hpf) | Description | Time (hpf) | Description |
|---|---|---|---|
| 24 (hpf) | Early trochophore larvae | 36 (hpf) | Mid trochophore larvae |
| 48 (hpf) | Early metatrochophore larvae | 72 (hpf) | Early nectochaete larvae |
| 4 d | Mid nectochaete larvae | 10 d | Errant juvenile |
| 15 d | 3-segmented errant juvenile | ||
| 1 Mpre | |||
| 1 Mpost | |||
| 3M | Adult | ||
| Male | Sexualy mature adult | Female | Sexualy mature adult |
Back to top
2. Expression data
The PdumBase web interface displays the mean FPKM (fragments per kilobase per million reads mapped) as the default measurement of gene expression. The FPKM for each replicate was obtained by normalizing the total number of mappable reads with the corresponding transcript length. A transcript or gene is considered as expressed if its FPKM is > 1. Furthermore, the FPKM for each stage was obtained by combining the replicates into a single set.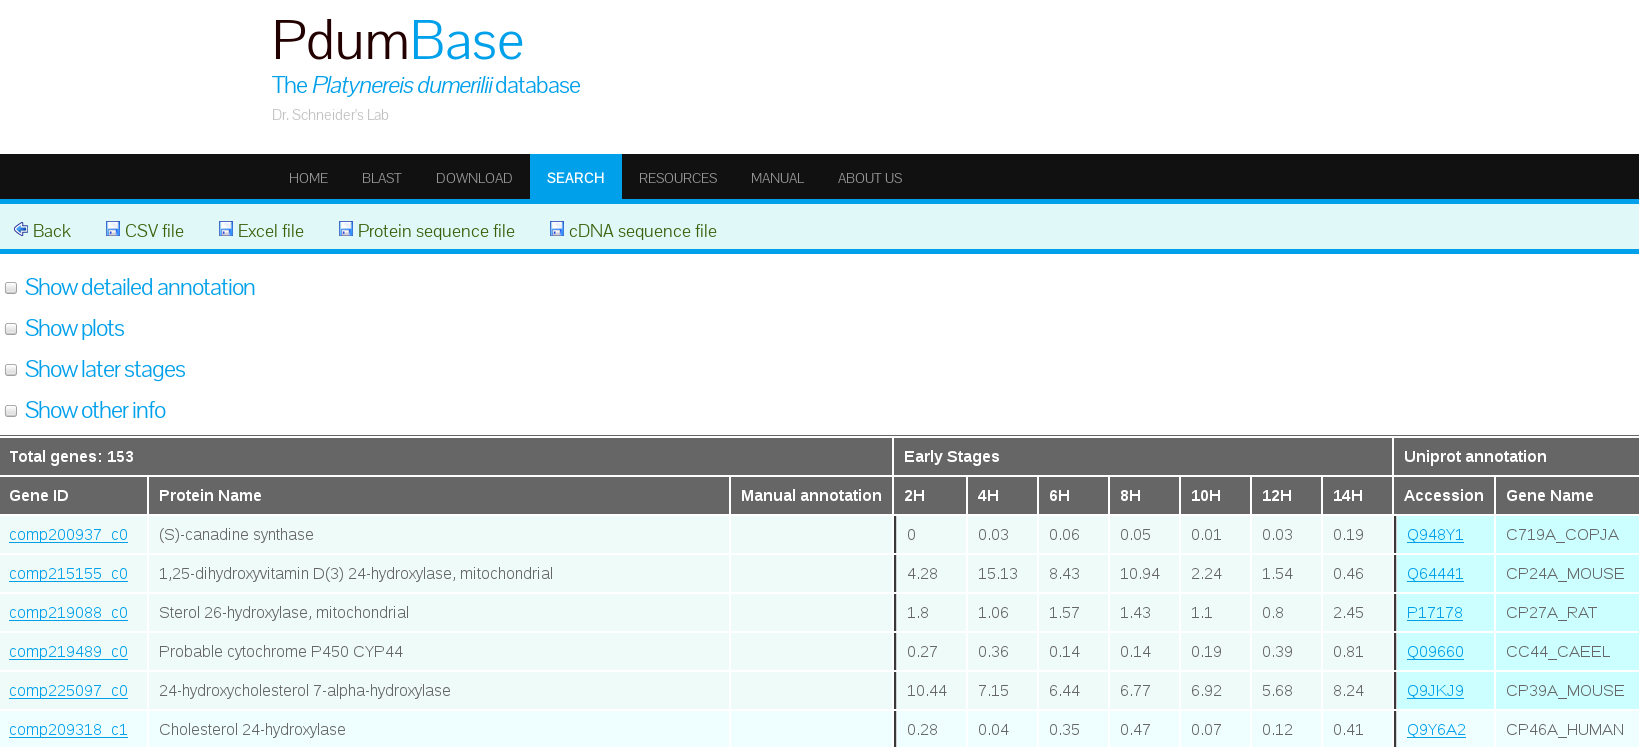
(A)
(B)
3. Annotation
This section is concerned with describing the different annotations, how these were sourced from external databases for convenient browsing and data exploration specific to Platynereis dumerilii.Uniprot Annotation
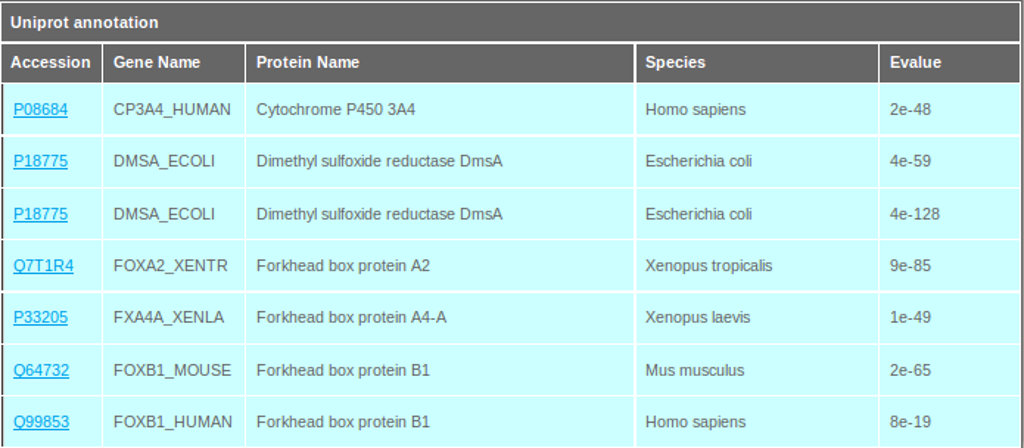
The PdumBase search results interface retrieves the Uniprot annotation data, displaying the Uniprot accession number, gene name, protein name, the species of annotation origin, and the E-value (see Figure 3).The annotation was performed using BLASTP by aligning the transcripts with predicted open reading frames (ORF) against non-redundant SwissProt databases. A total 31,806 transcripts (17,213 genes) retrieved at least one hit using an E-value cutoff of 10-10. Among the annotated transcripts, 26% aligned to human and 19% to mouse proteins.
Pfam Annotation
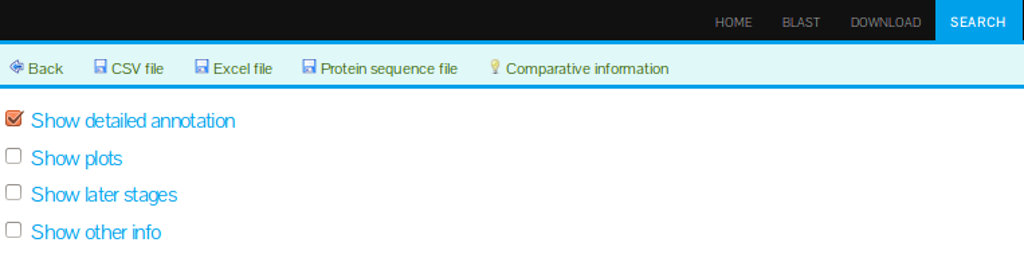
We also annotated for potential protein domains by aligning all transcripts against the Pfam database. The Pfam annotation can be accessed in the database web interface by selecting the option "Show detailed annotation" on the search results page, or by clicking on the tab "Annotation" after having selected a particular transcript from the result interface (see Figure 3).Annotation was performed using HMMER. We were able to assign Pfam domains to 32,464 transcripts (18,146 genes), identifying a total of 431,701 Pfam domains. Furthermore, out of the transcripts with domain annotations, 28,326 (15,690) were also present in the Uniprot BLASTP annotation.
KEGG Pathways Annotation
Identifying the active biological pathways in early stages is crucial to decipher the mechanisms involved in the diversification of embryonic cells. The Kyoto Encyclopedia of Genes and Genomes (KEGG) provides well-annotated pathway databases including metabolism, genetic and cellular processing.Our assembled transcripts were mapped to KEGG pathways. In total, 18,532 transcripts (10,132 genes) are associated with the known KEGG pathways.
In our database, the KEEG annotation is accessible by selecting the option "Show detailed annotation" as seen in Figure 4.
(A)
(B)
Gene Ontology Annotation
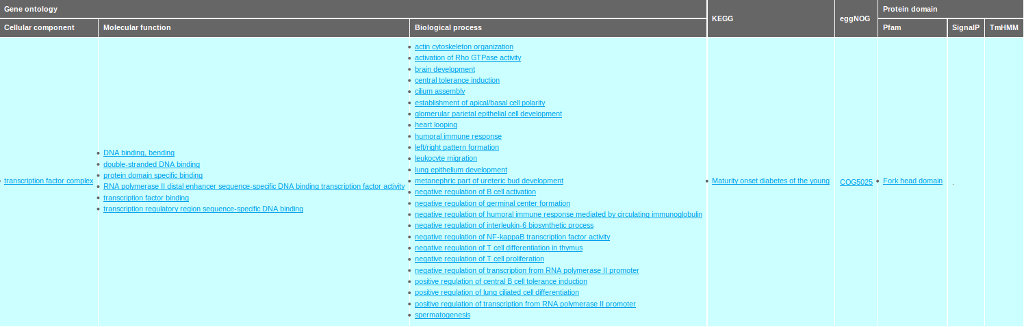
The assembled transcripts were also annotated with Gene ontology (GO) terms of homologous genes. A total of 30,287 transcripts (16,498 genes) could be associated with at least one annotated GO term. The GO annotation shows high enrichment in the function associated with transcription and regulation activities in the biological process and molecular functions. The GO terms related to cell differentiation such as “cell transduction”, “cell adhesion”, “cell division” and “cell cycle” are also enriched.All annotation information for a given transcript is summarized and displayed in the annotation tab interface (see Figure 5 ).
It is worth pointing out that one important feature of our database is that the search interface allows for the submission of searches under Blast Info, Pfam, Gene Ontology, and Kegg Pathway, making it possible to narrow down a request by a particular annotation of interest.
4. Gene Expression Profiling
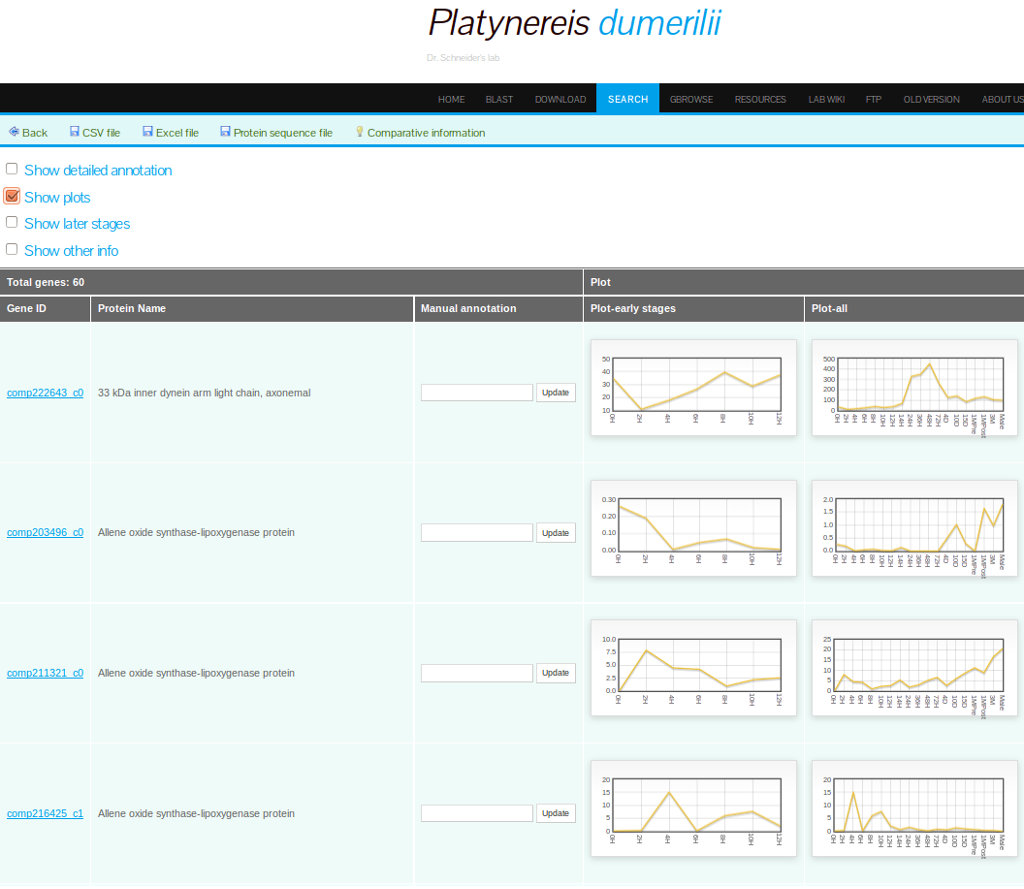
PdumBase includes a detailed gene expression profiling of the early developmental stages (2 to 14hpf). An expression profile can be interpreted as the changes in the abundance of a transcript over time.Plots depicting these fluctuations of transcript abundance (FPKM) are shown for each transcript. Accessing this data is available via the option "Show Plots" on the search result page (Figure 6), or by clicking on the transcript of interest and selecting the tab labeled "Plots" (Figure 7).
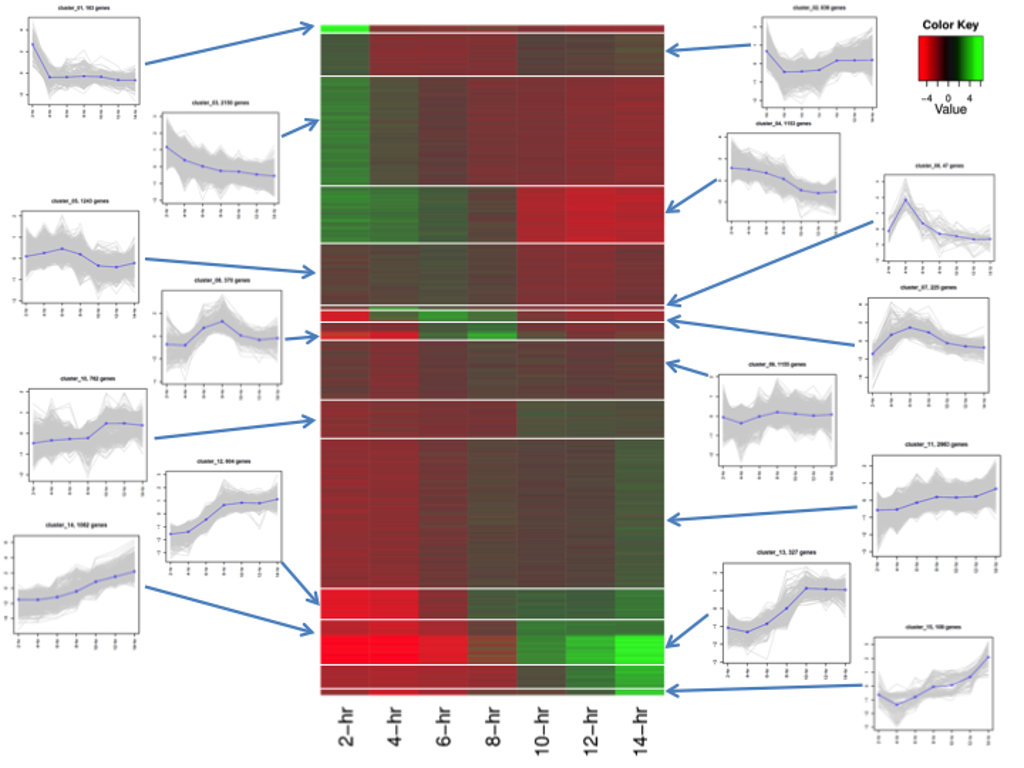
Access to the cluster information is available by selecting the option "Show other info" on the result search page and then, for a selected transcript/gene, clicking on the icon under "Coexpression info". The first tab of the new results page will display all the genes in the same cluster, along with other expression data (see Figure 9).
Back to top
5. Coexpression Networks
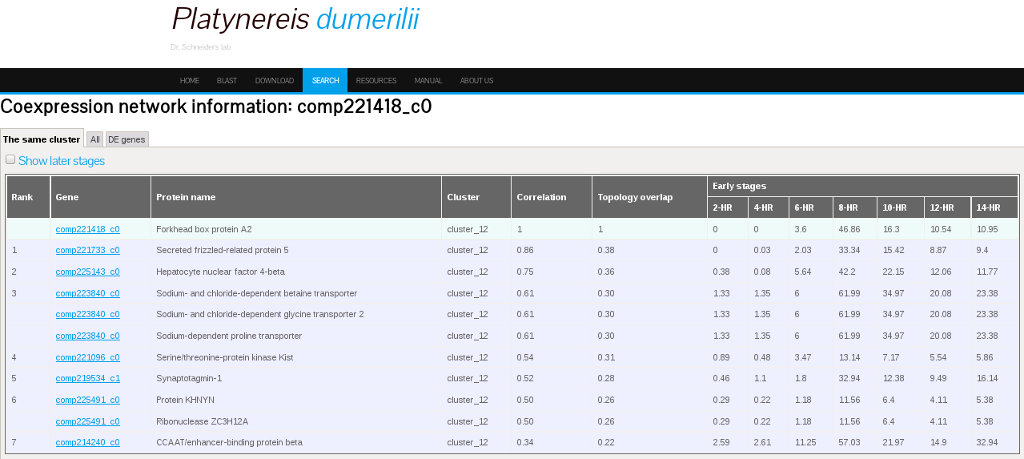
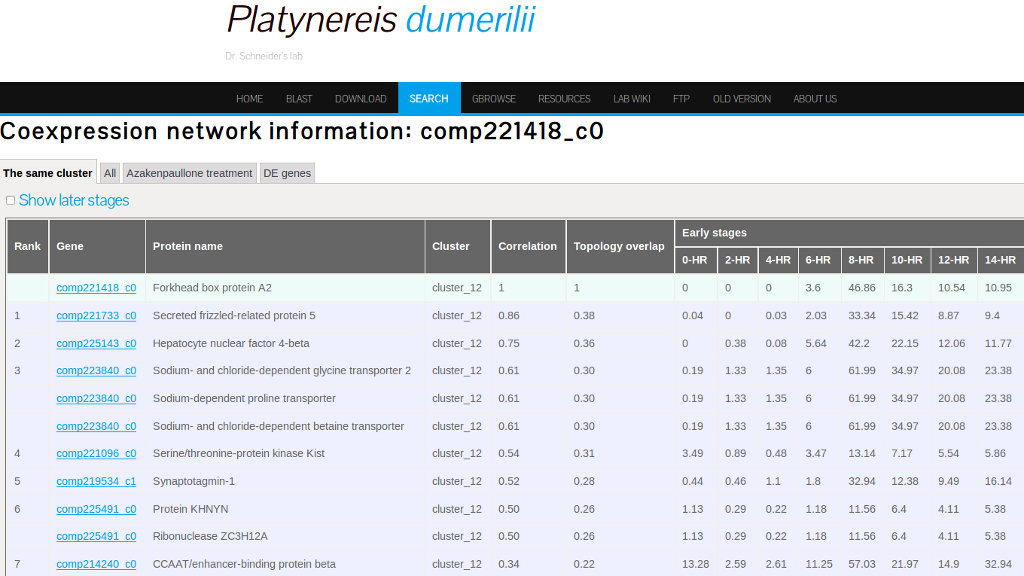
A coexpression network is a correlation network that describes the pairwise correlation patterns of expression data. When a set of genes are highly correlated, they may share similar biological function or be involved in the same biological pathway. A coexpression network can also be used for identifying hub genes which have high connectivity to other genes in a cluster. We used weighted correlation network analysis (WGCNA) to analyze Platynereis dumerilii expression profiling data.For this analysis, we included a total of 13,192 genes whose FPKM was > 1 for at least one sample. Correlation values and topology overlap for the coexpression networks can be found in the database on the Coexpression information interface. This page can be reached from the search result interface by selecting the option "Show other info" and by clicking on the icon under the column "Coexpression info" in the results table. The Coexpression information interface is shown in figure 9.
6. Comparative Transcriptome Data
Ortholog Expression
With the aim of identifying conserved stages of development, we gathered publicly available expression data from five species for which we then identified orthologs w.r.t. Platynereis dumerilii (see tables 3 and 4) and proceeded to establish global comparison expression profiles among the ortholog groups.
Species and number of protein sequences for comparative analysis |
Species | Number of sequences |
|---|---|
| Platynereis dumerilii | 28,580 |
| Danio rerio | 26,241 |
| Xenopus tropicales | 18,442 |
| Homo sapiens | 23,393 |
| Nematostella vectensis | 27,273 |
| Ascaris suum | 15,446 |
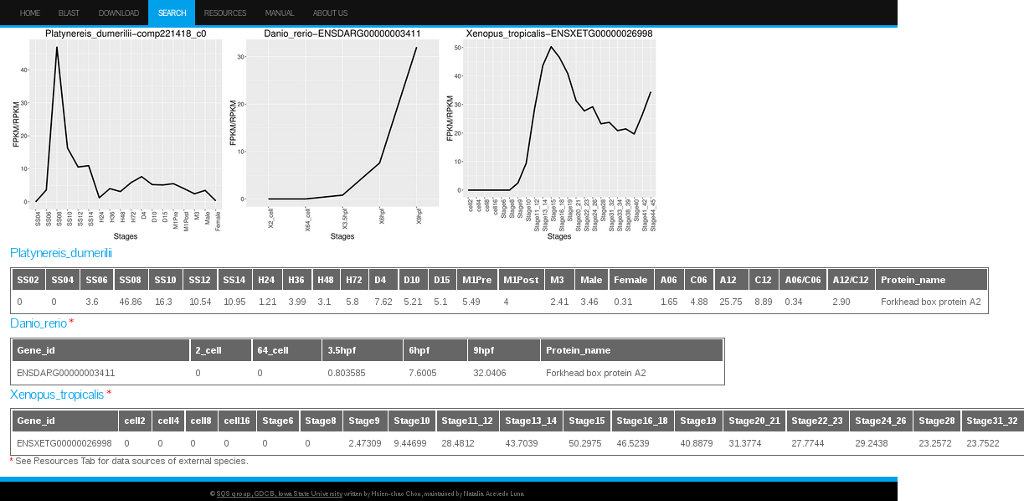
The ortholog expression data for a particular Platinereis dumerilii transcript, can be found in our database by selecting the option "Show other info" and by clicking on the icon under the column Ortholog Expressions for the specific transcript of interest. The resulting interface will display the ID number and expression data for the orthologs found for that transcript/gene in the other 5 species (see Figure 10).
Number of orthologs genes between the 6 species |
Species | Platynereis dumerilii | Danio rerio | Xenopus tropicales | Homo sapiens | Nematostella vectensis | Ascaris suum |
|---|---|---|---|---|---|---|
| Platynereis dumerilii | 5635 | 5402 | 5051 | 5840 | 3654 | |
| Danio rerio | 10784 | 10246 | 6731 | 4307 | ||
| Xenopus tropicales | 10284 | 6415 | 4140 | |||
| Homo sapiens | 6094 | 3941 | ||||
| Nematostella vectensis | 4245 | |||||
| Ascaris suum | ||||||
Back to top
Ortholog Groups
We also identified orthologs genes for 18 selected species (Table 5) using the program OrthoMCL. This program runs all versus all Blastp queries among all the protein sequences from these 18 species and selects the best reciprocal blast hits. Once the orthologs genes were identified, phylogenetic trees were assembled using RaxMl.
Species and number of genes used to find orthologs groups |
Class | Code | Species | Number of genes |
|---|---|---|---|
| Lophotrochozoa | pdu | Platynereis dumerilii | 28,580 |
| Lophotrochozoa | cte | Capitella teleta | 32,415 |
| Lophotrochozoa | hro | Helobdella robusta | 23,423 |
| Lophotrochozoa | lgi | Lottia gigantea | 23,851 |
| Lophotrochozoa | cgi | Crassostrea gigas | 26,089 |
| Ecdysozoa | dpu | Daphnia pulex | 30,907 |
| Ecdysozoa | tca | Tribolium castaneum | 16,524 |
| Ecdysozoa | dme | Drosophila melanogaster | 13,937 |
| Deuterostomia | spu | Strongylocentrotus purpuratus | 20,759 |
| Deuterostomia | sko | Saccoglossus kowalevskii | 34,239 |
| Deuterostomia | bfo | Branchiostoma floridae | 50,817 |
| Deuterostomia | dre | Danio rerio | 26,459 |
| Deuterostomia | xtr | Xenopus tropicalis | 18,442 |
| Deuterostomia | hsa | Homo sapiens | 23,393 |
| Prebilateria | nve | Nematostella vectensis | 27,273 |
| Prebilateria | aqu | Amphimedon queenslandica | 29,883 |
| Prebilateria | tad | Trichoplax adhaerens | 211,520 |
| Preanimalia | mbr | Monosiga brevicollis | 9,196 |
To access the ortholog genes for a given Platynereis dumerilii transcript/gene, select the option "show other info". If ortholog groups are found for that particular transcript, a check-mark will appear under the field "Ortholog groups". Clicking on this icon will open a new interface with four tabs:"List", "Tree-ML", "Tree-Parsimony", and Alignment (see Figures 11, 12, and 13 respectively).
(A)
(B)
Back to top
Section 2: Tutorial Examples
Example 1. Searching By Keyword
This section will show some of the PdumBase features through exemplary searches using the blast info search function.
Search
The search interface allows to submit searches under different criteria: By keyword, Pfam, SingalIP, TmHMM, EggNog, Gene Ontology, and KEEG Pathway (Figure 14). By searching under different or combined fields, the search can be customized according to the user needs.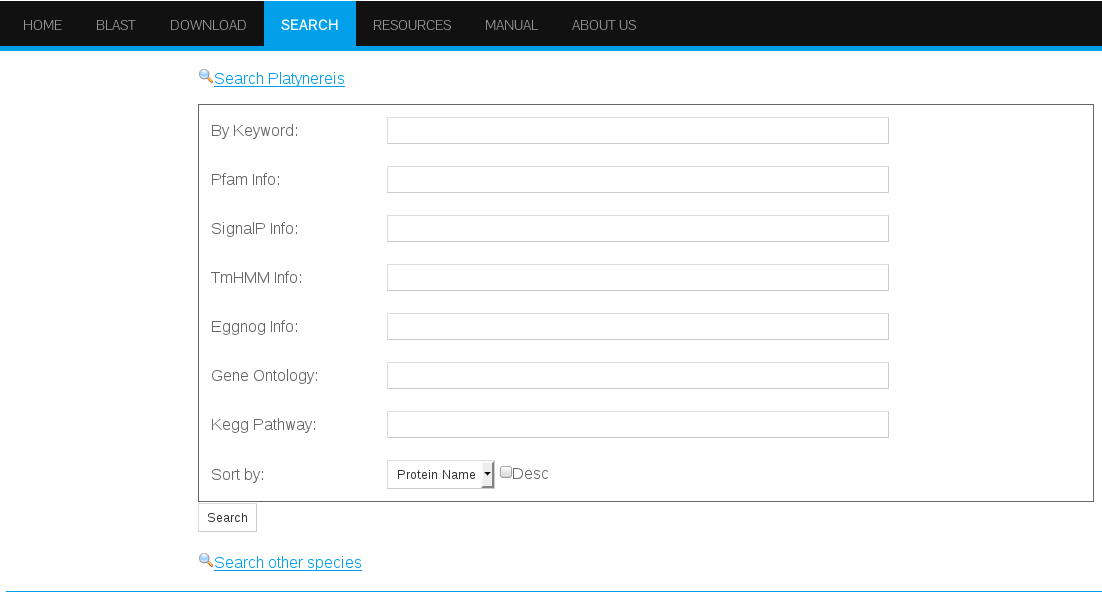
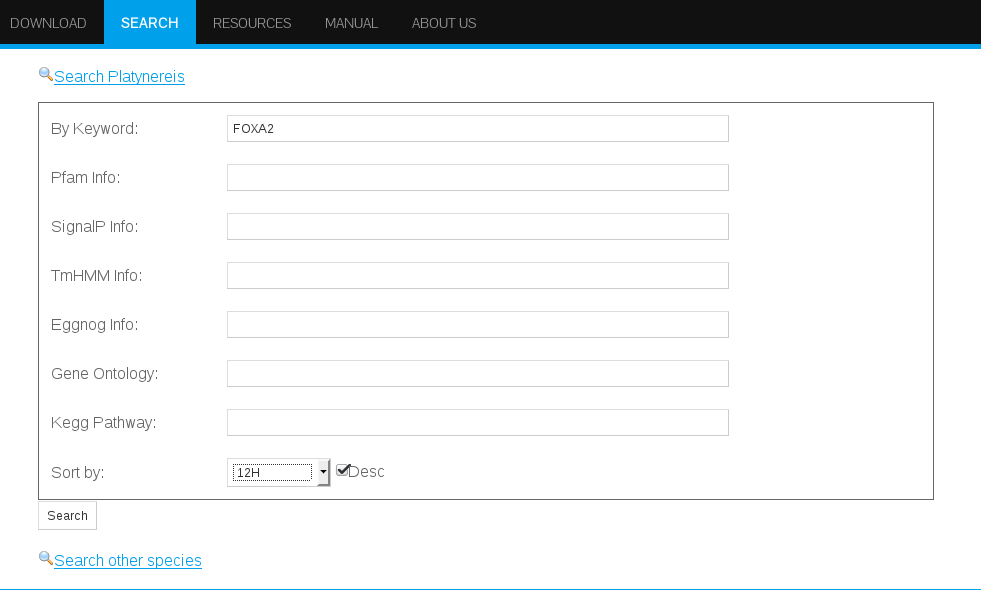
In addition, the search interface offers the option of selecting a sorting criteria to retrieve the results according to the expression values from any stage (2 to 14hpf) (Figure 15). This feature can be particularly convenient when searching with terms that might result in a multitude of hits such as "cell cycle" which retrieves more than 1000 genes, or "membrane" with around 500 hits. Therefore, searching for general terms might result in a request which could take more than 60 seconds to load. Please allow time for those general searches to load.
On the other hand, when searching for a particular gene name, for instance the transcription factor FoxA2 in the field By keyword, the most likely outcome will be one single hit displaying the Platynereis dumerilii transcript/gene with that particular annotation.
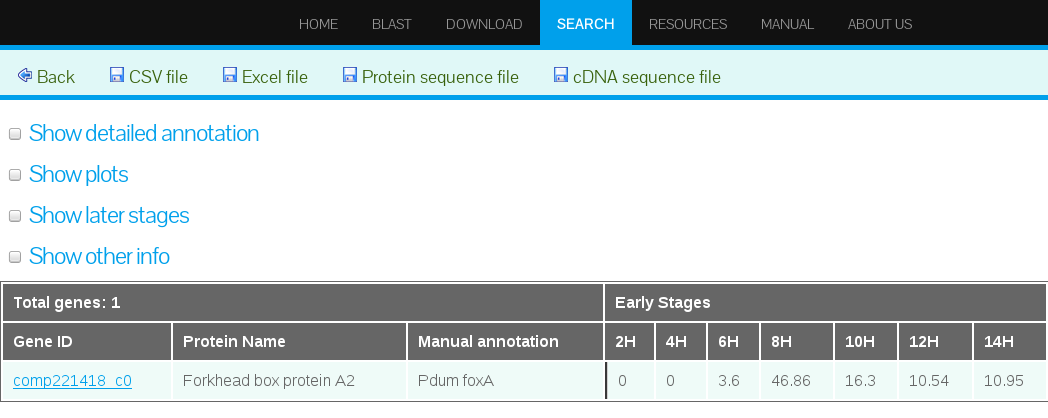
Search Results
The resulting search results interface displays by default the transcript or gene model ID, protein name, expression data as mean FPKM from early stages (2 to 14 hpf), expression data in inhibitor experiment, and annotation information (Figure 16).
In addition, the results interface allows to expand the results displayed by selecting from the options on the left upper corner. The user can select one or more options according to his/her particular research needs (see also Expanded search result options Section).
Access to Detailed Information
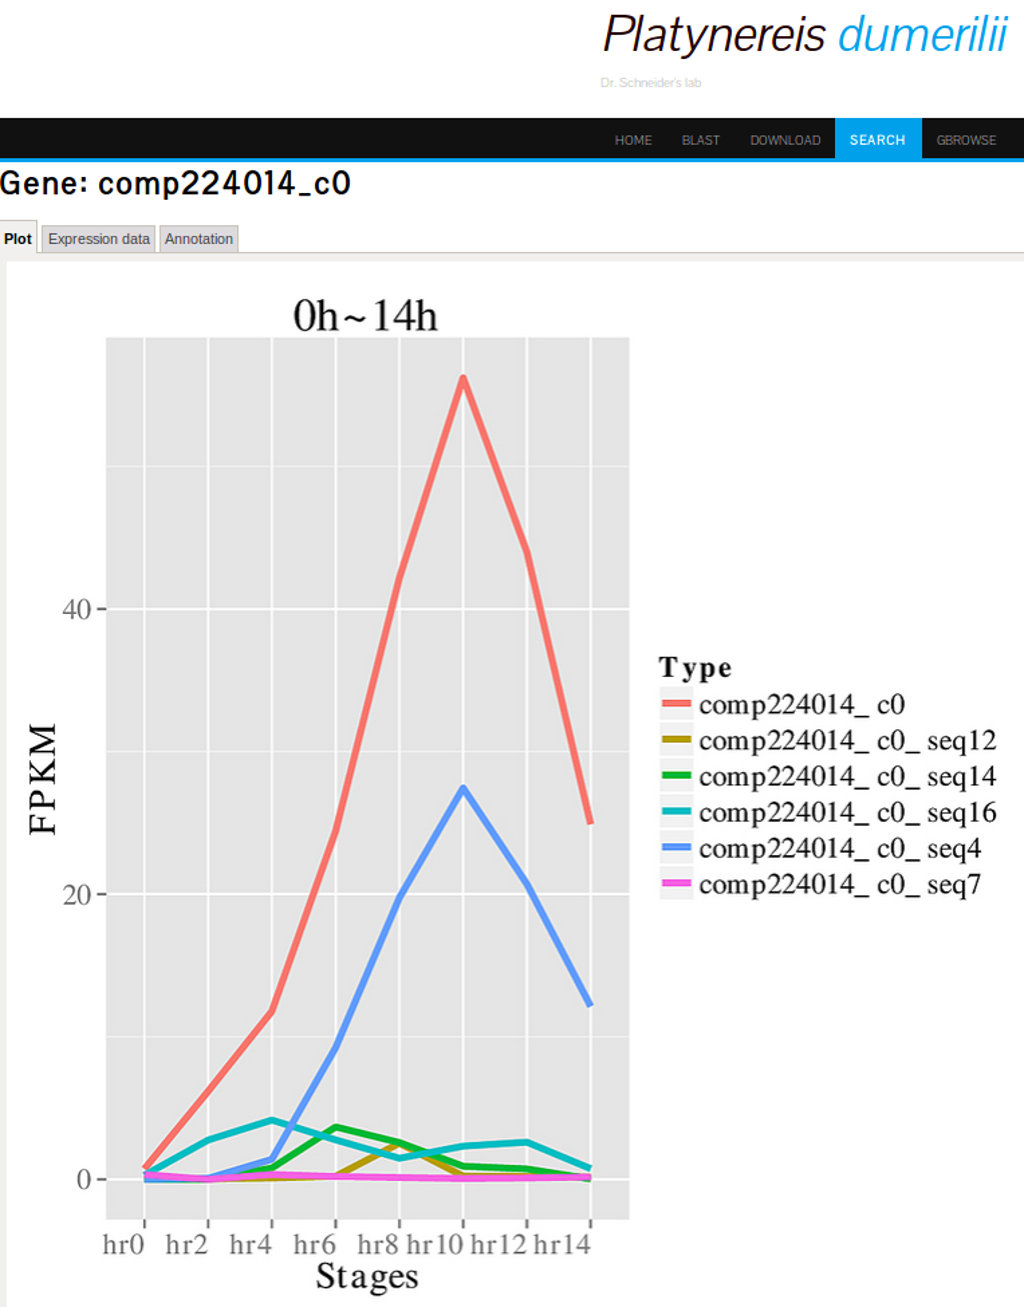
Clicking on the gene model for FoxA2, "comp221418_co", will give access to the detailed data results interface. The detailed data results page has three tabs: Plot, Expression data and Annotation, from which different information can be accessed.The Plot Tab
Clicking on the Plot tab will display expression profile data (FPKM values against stages) for early and late states (Figure 17).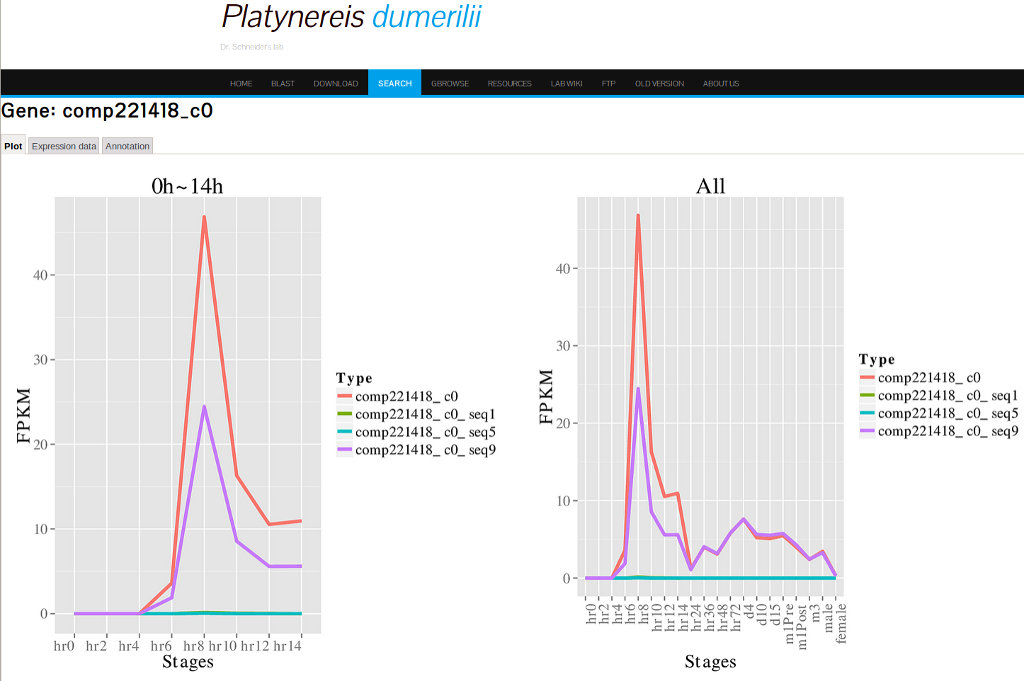
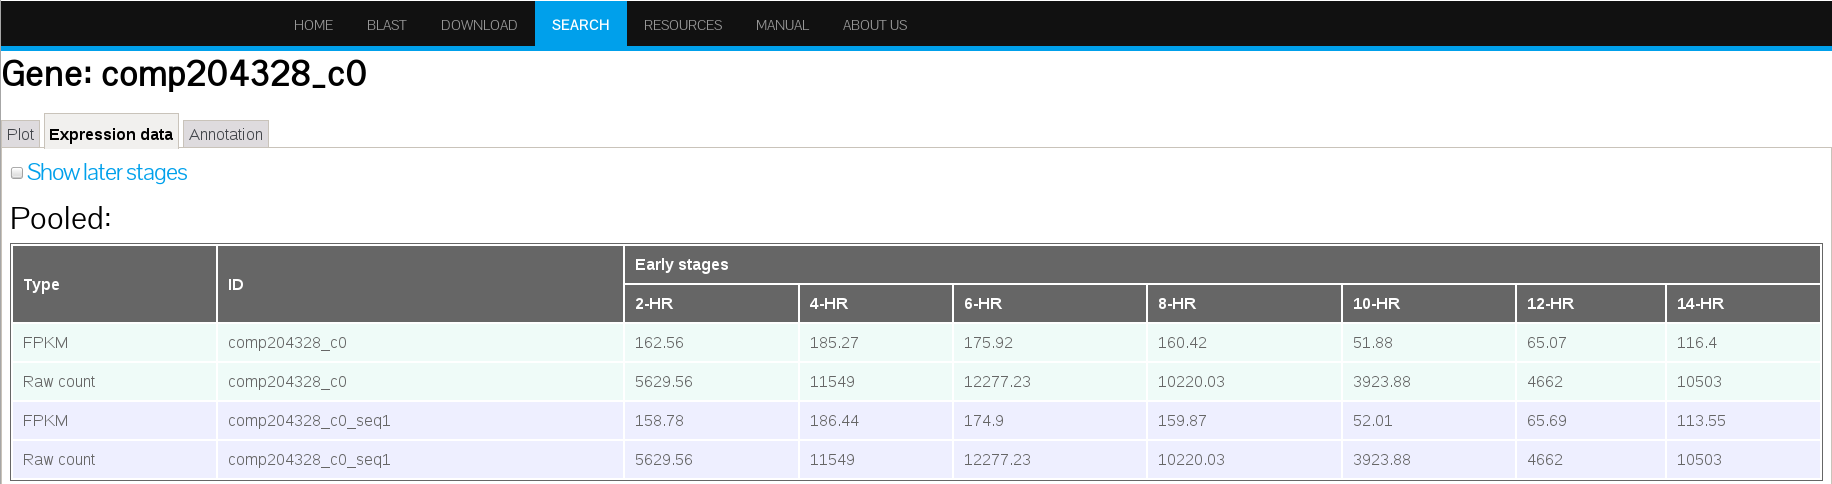
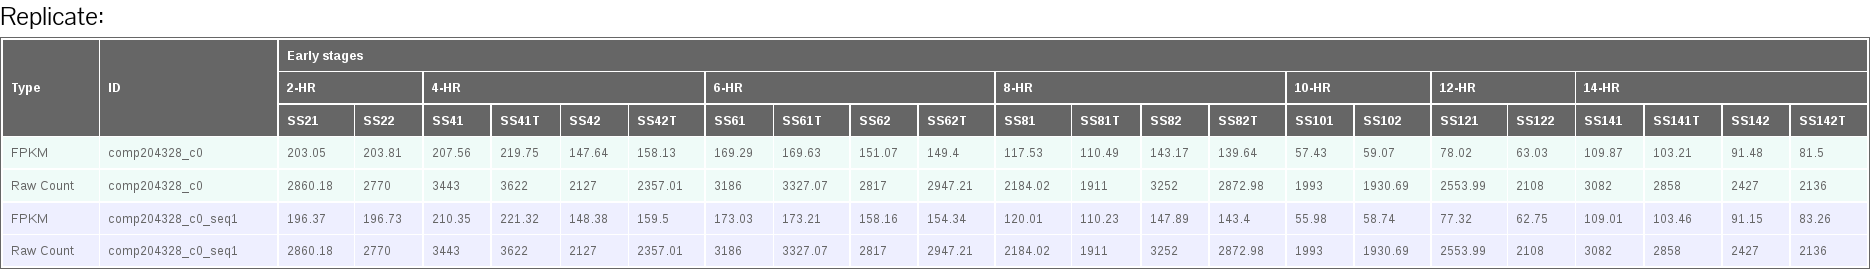
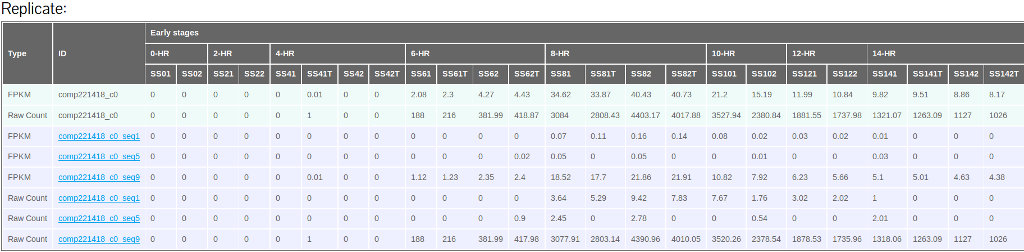
The Expression Data Tab
The Expression data tab will show mean and individual sample FPKM values as well as raw counts (Figure 18).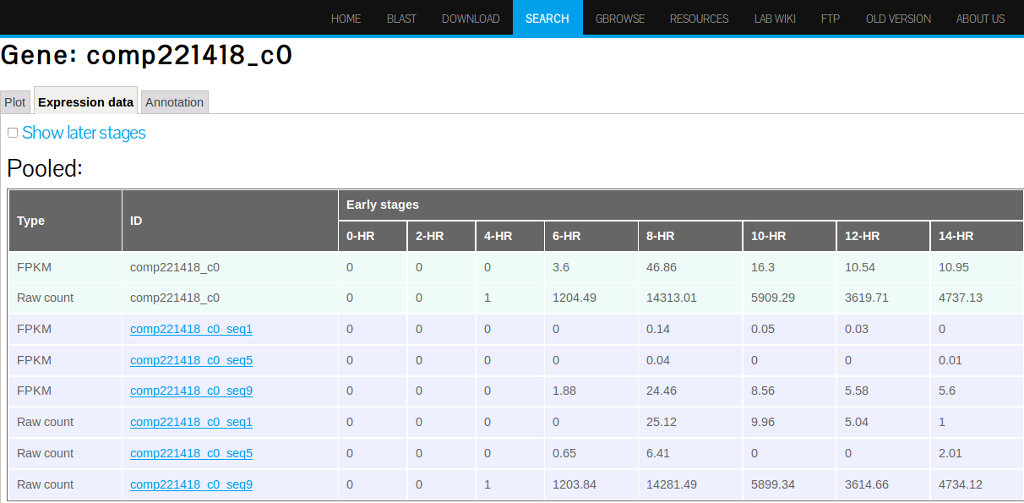
(A)
(B)
The Annotation Tab
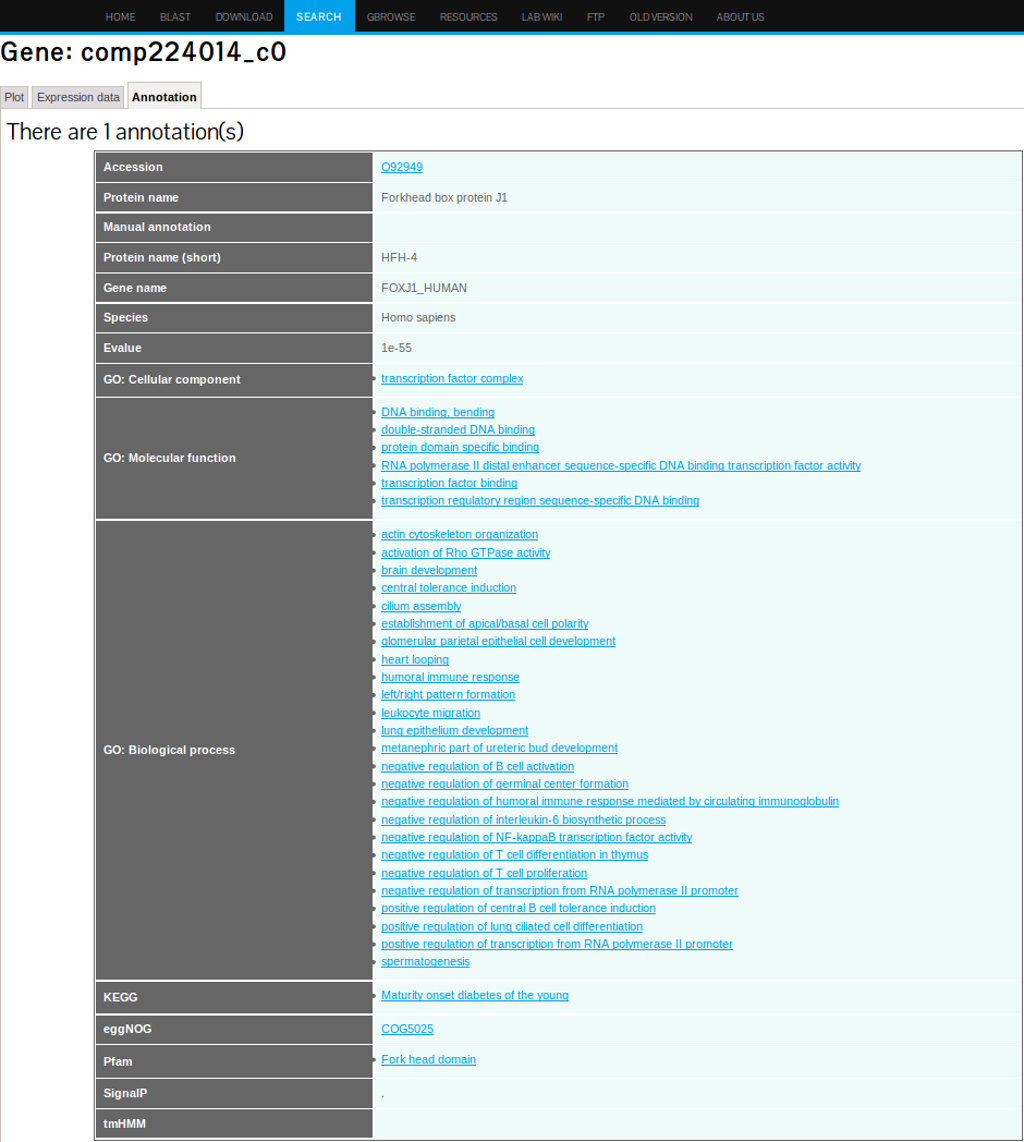
Clicking the annotation tab will retrieve a summary of all annotation related information including: Species from which the annotation was obtained, GO extended annotation, KEEG pathways, EggNog, and Pfam domains (see figure 19).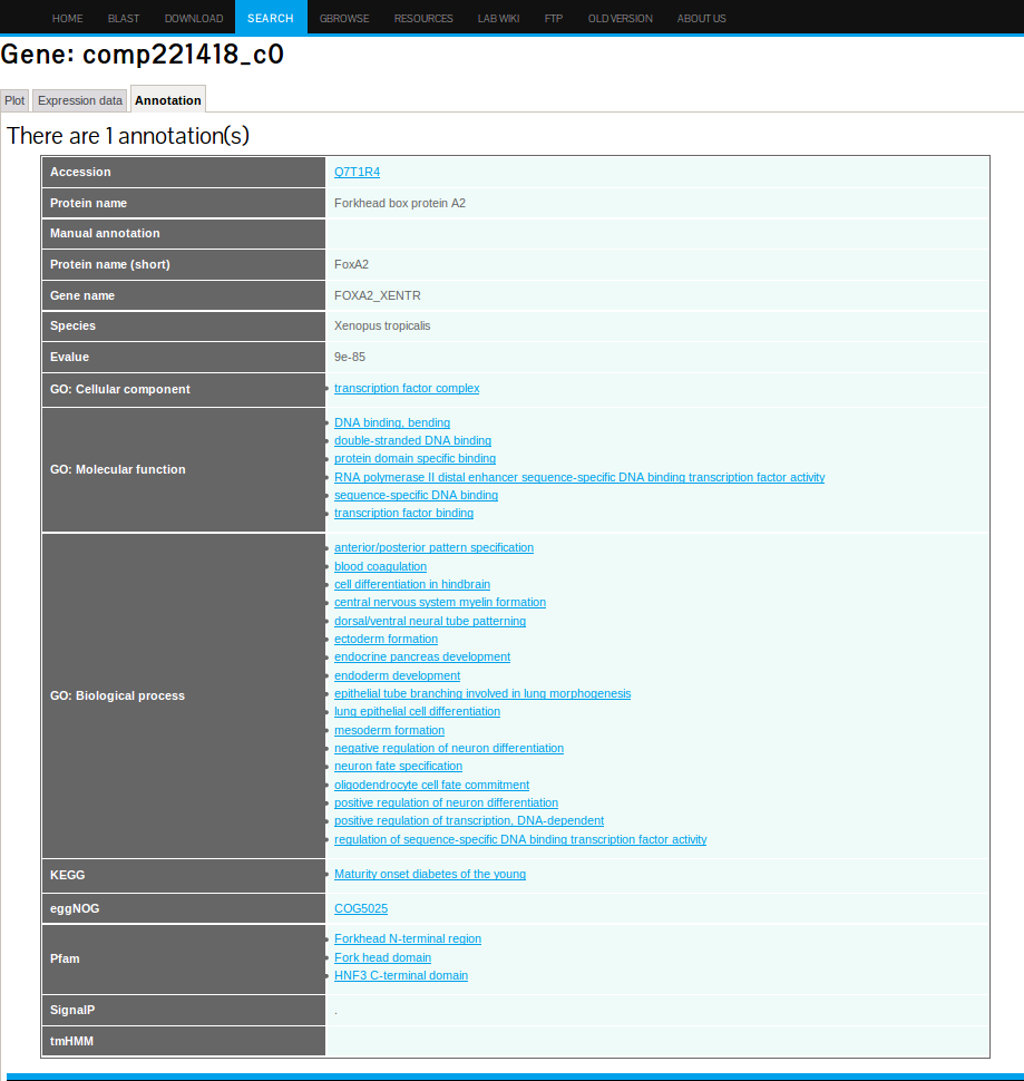
Expanded Search Result Options
The search result default data output can be expanded by selecting the options provided in the search results interface (Figure 18).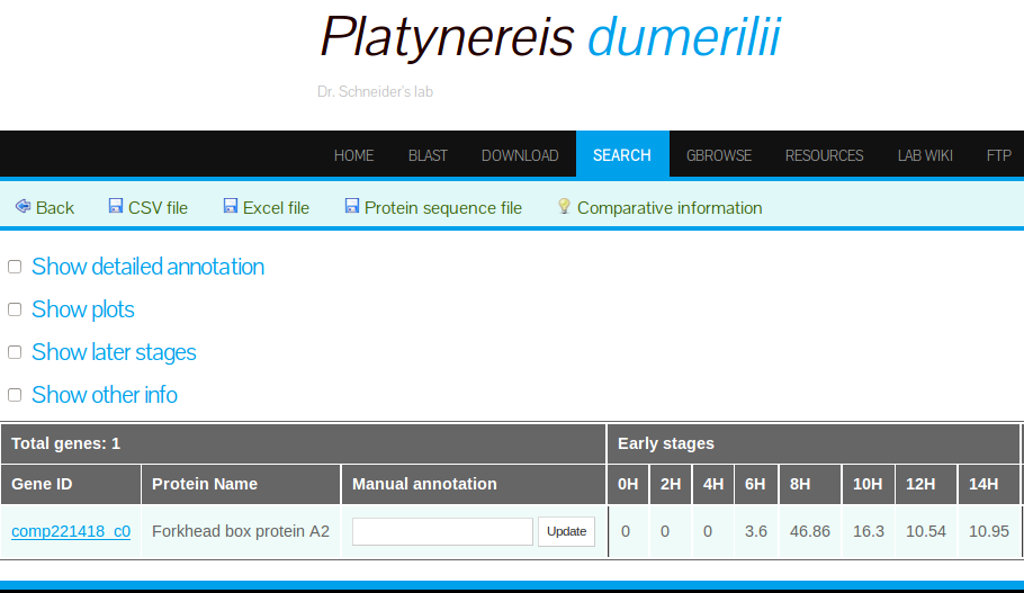
Selecting "Show plots"
Selecting the "show plots" option will retrieve a visual representation of early and late stage expression profile for all the Gene IDs displayed in the search result interface (Figure 19).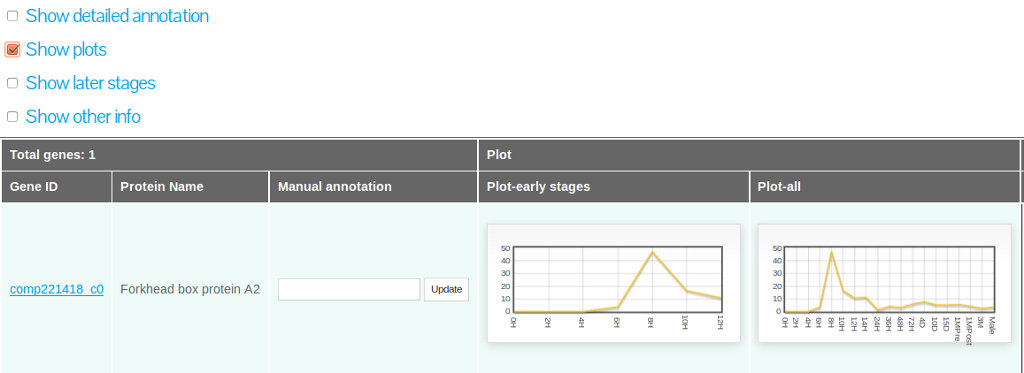
Selecting "Show later stages"
To display the mean expression data (FPKM) from later stages of development (24hpf to 3M) it is required to select the option "show later stages" as shown in figure 20.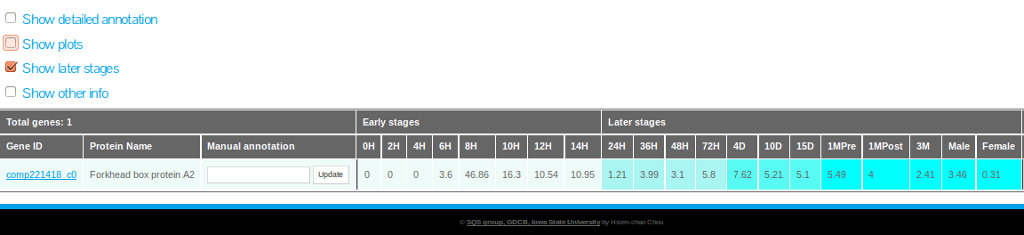
Selecting "Show other info"
Clicking "Show other info" provides access to additional data on comparative transcriptomics (see Figure 21):- Ortholog Expressions - if available a green check-mark icon will be displayed.
- Ortholog groups - if available a green check-mark icon will be displayed.
- Coexpression info - if available a blue icon will be displayed.
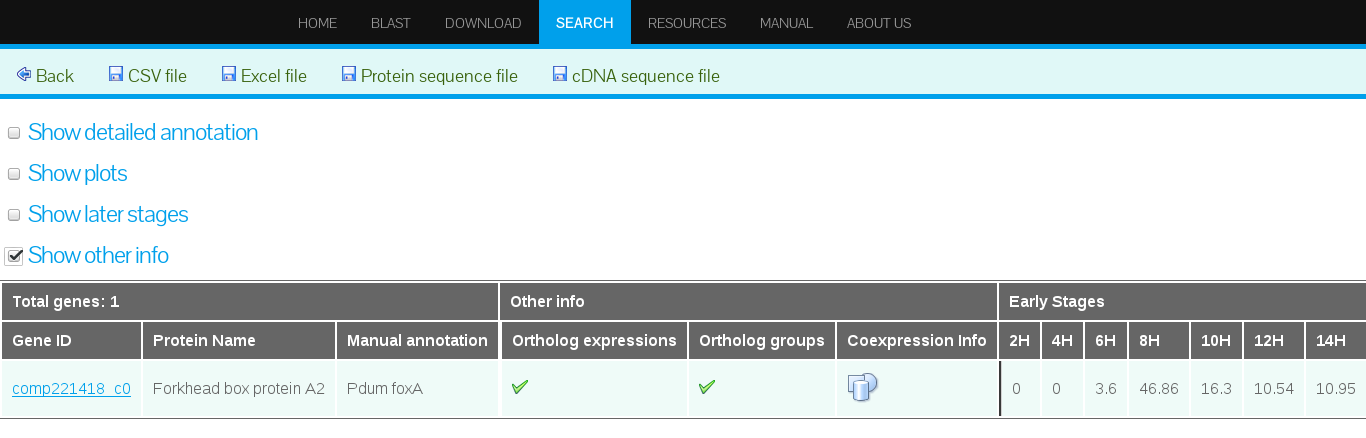
It is important to mention that the additional data is not available to all the gene models but only to those transcripts for which orthologs genes were identified. See Table 4 for the estimated numbers of orthologs found.
Coexpression link
Selecting the coexpression link gives access to data about the expression profiling and coexpression. "The same cluster tab" from this interface displays the Gene ID of all genes belonging to the cluster of the gene under search (see Figure 22).
Orthologs groups link
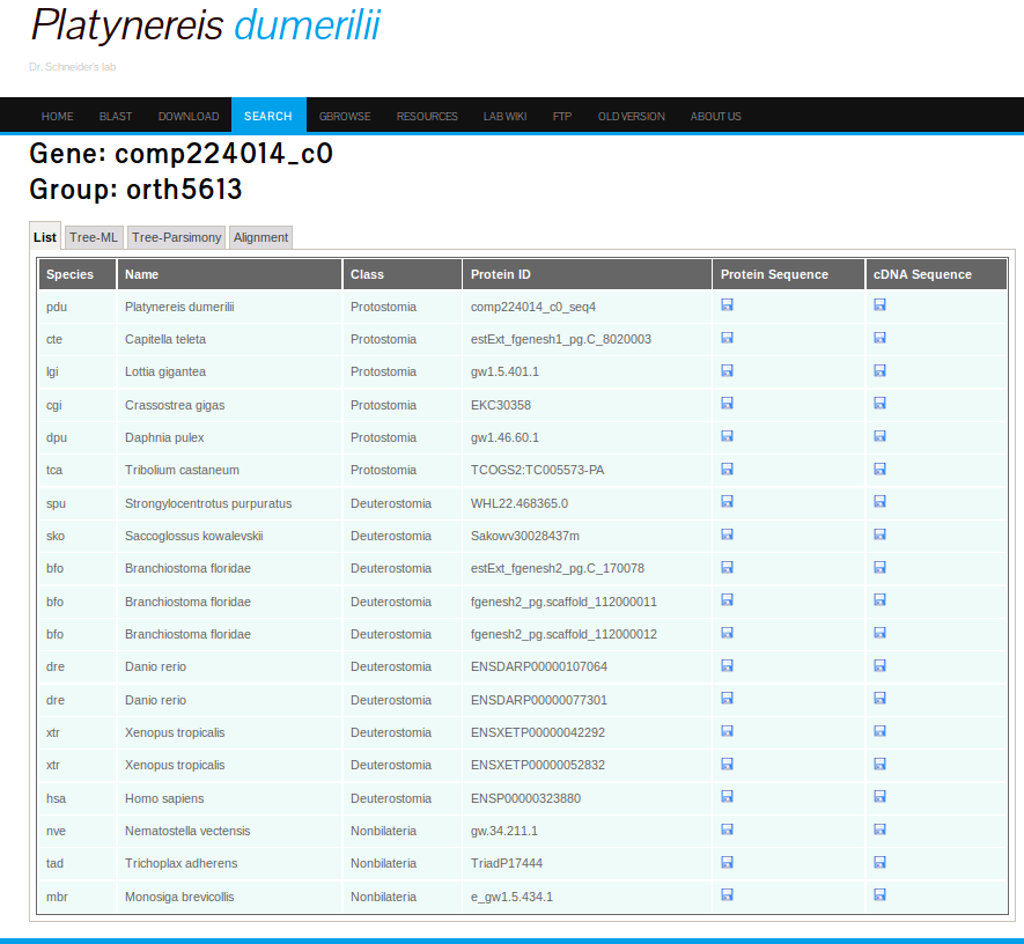
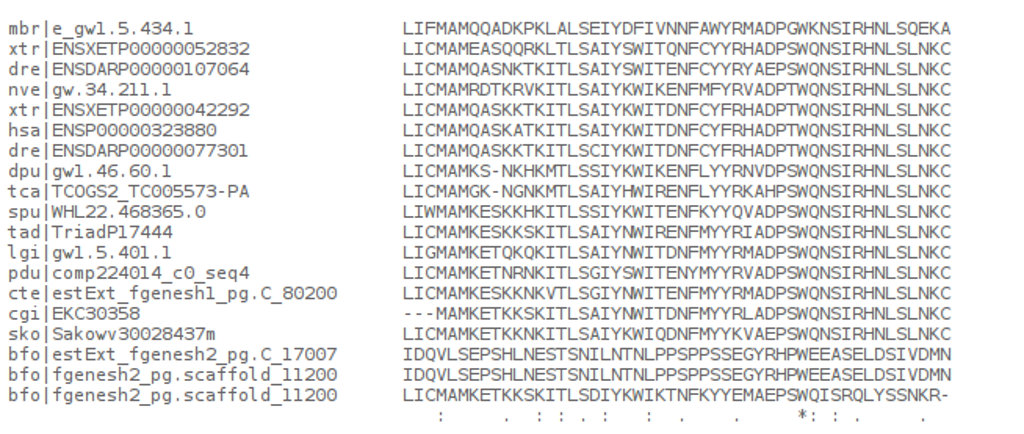
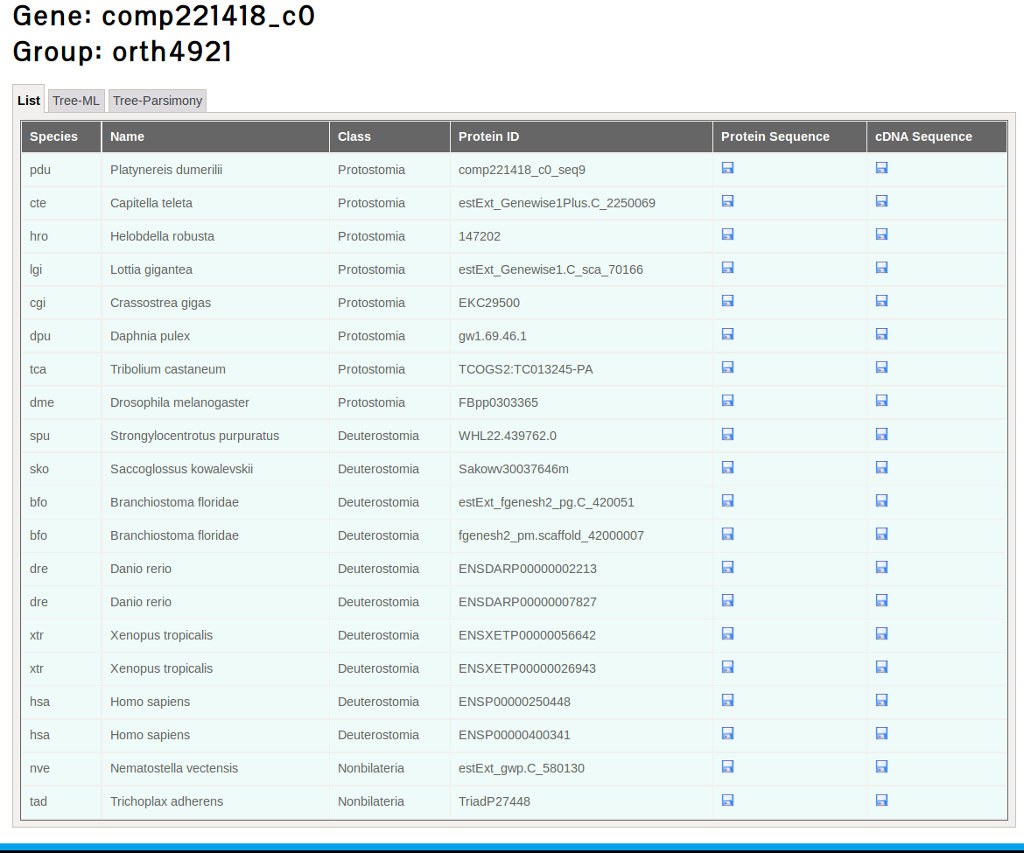
Clicking the Orthologs groups link gives access to an interface with tree tabs: List, Tree-ML and Tree-Parsimony. As mentioned in the section "Comparative transcriptome data", 18 species were selected to assess the ortholog groups. The first tab shows the list of species from which orthologs were found for the searched gene. This interface also allows to download the protein and cDNA sequences of the orthologs in Fasta format (see Figure 24).
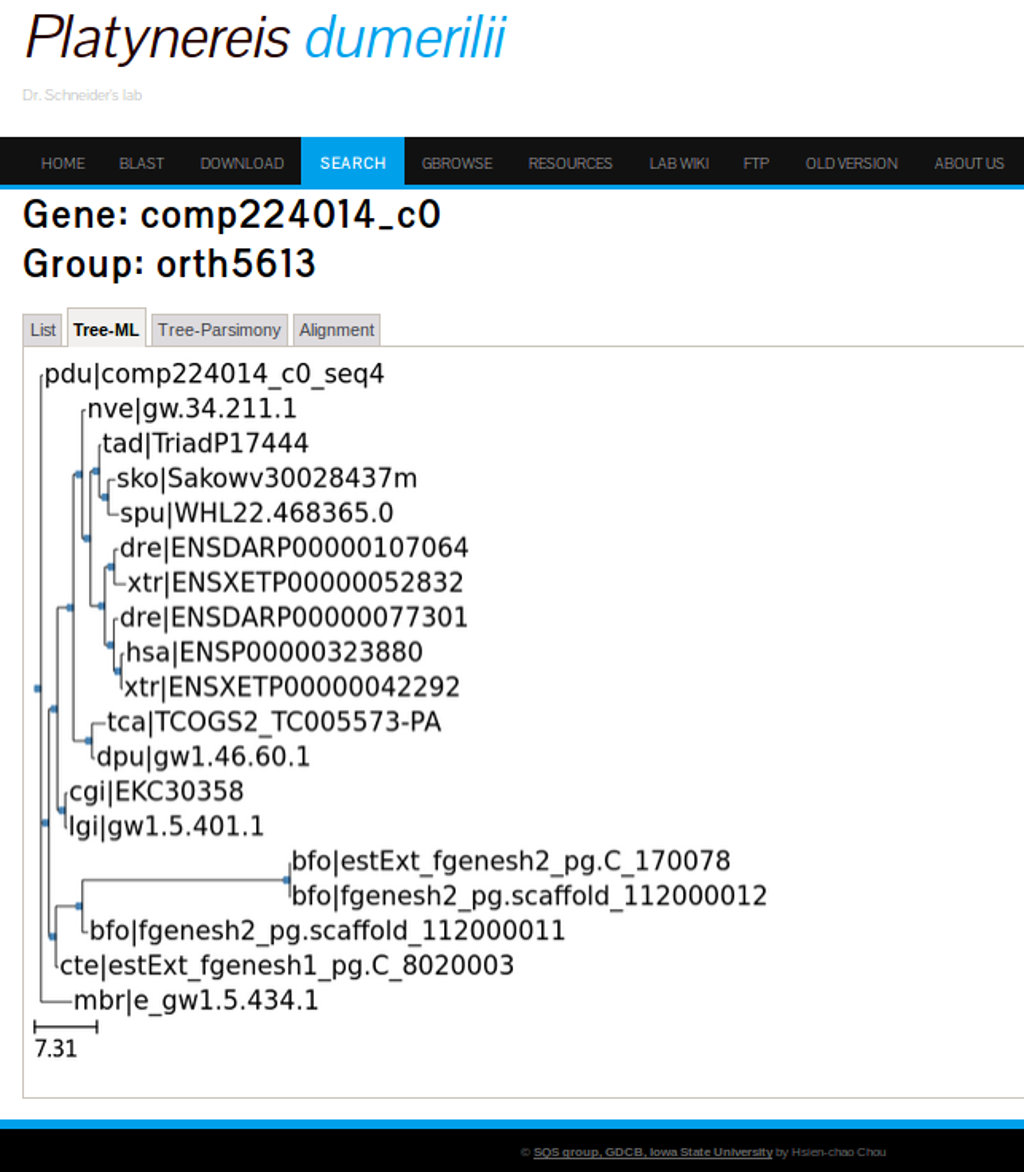
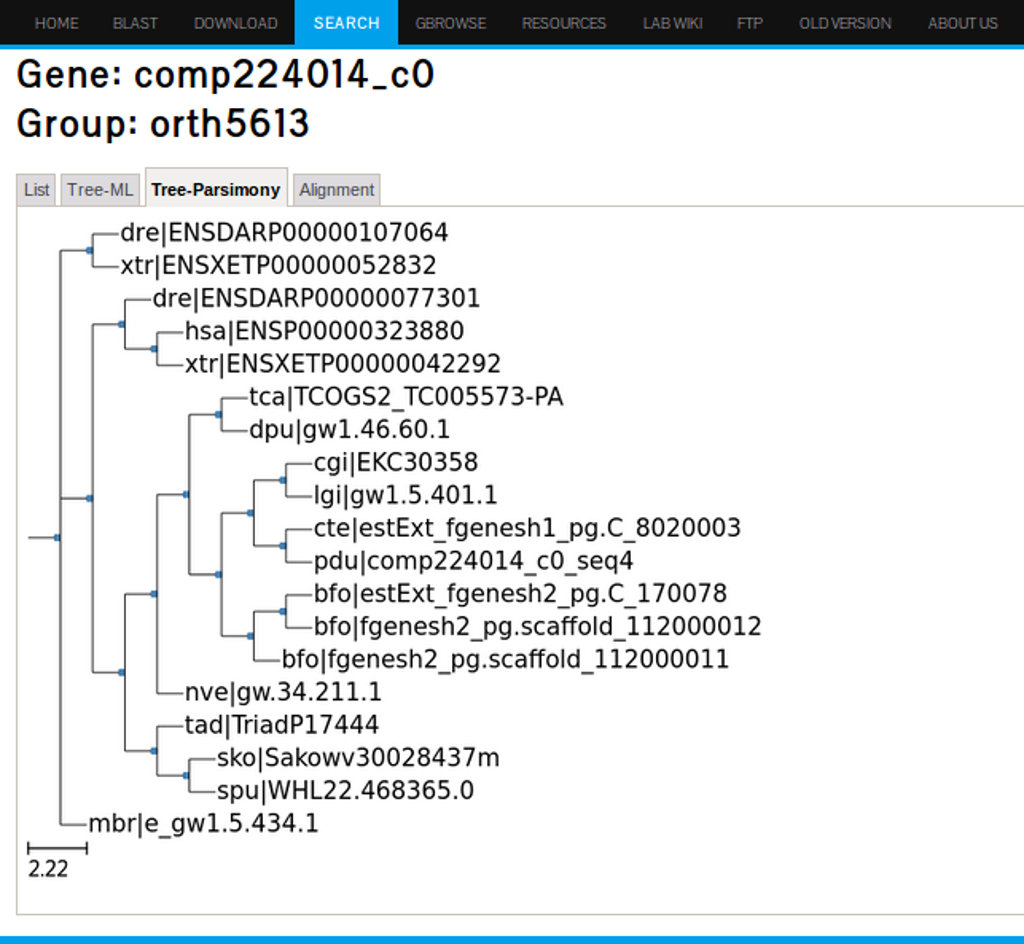
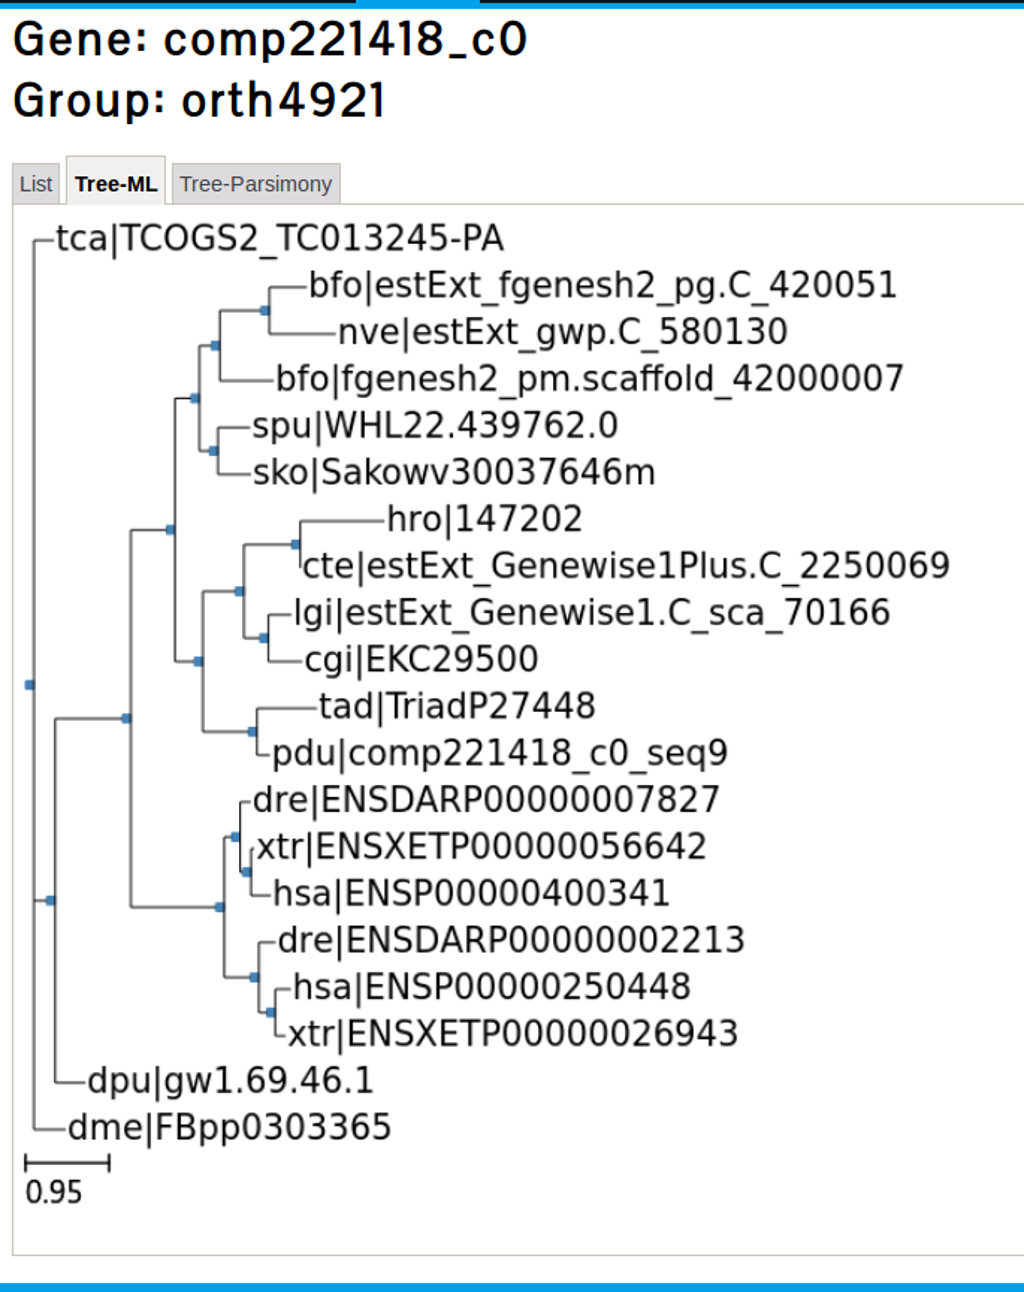
The second and third tab under the Orthologs groups link will display phylogenetic trees based on ML and parsimony analysis respectively. Figure 25 shows the tree-ML for the FoxA2 ortholog genes.
Back to top
Example 2. search for "Homeobox genes"
This final example will show a sample search with multiple results, indicating the options that our web database offers to download the data in case further analysis is required.Finding homeobox genes that are highest expressed at 8hpf
Searching for homeobox term in the blast field at the search interface will retrieve 114 hits. To find the highest expressed homeobox genes at 8 hpf, is is required to sort the hits by expression values at 8 hpf in descending order (See Figure 26).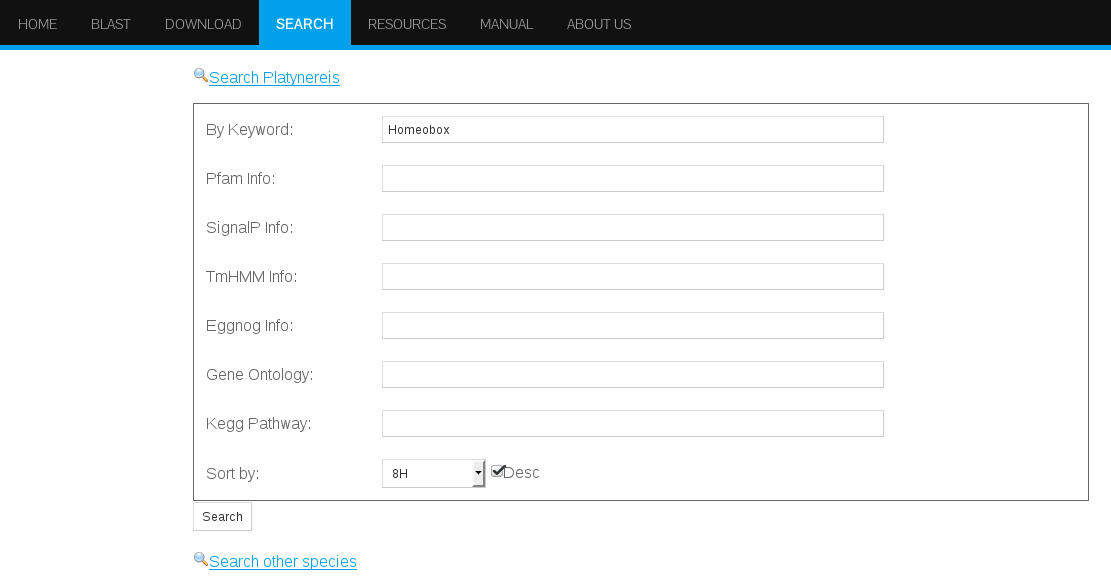
Back to top
Downloading results from PdumBase
One important feature of our web database is that it allows to download the search results in different formats. The search results can be downloaded in both, comma separated value (CVS) format file and Excel file. Furthermore, the protein sequences from the genes displayed in the results can be downloaded in Fasta format. Links to download are found in the upper frame of the search result interface (see Figure 26).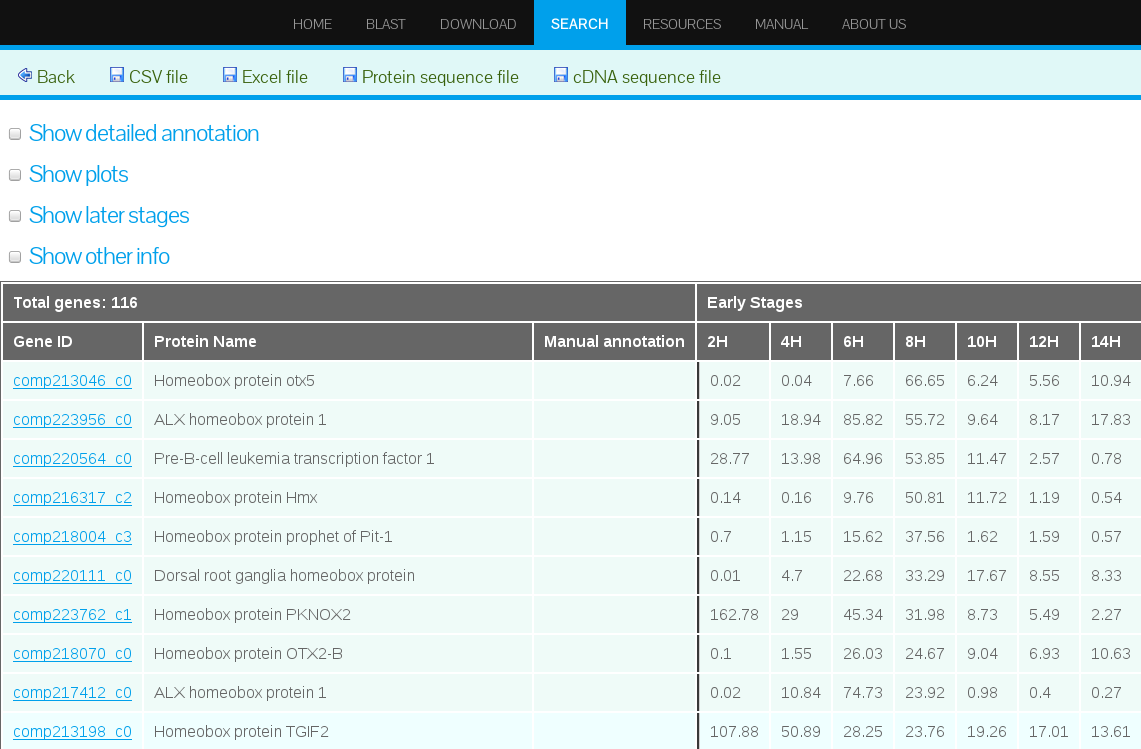
Concluding Remarks
Given the here presented features and ease of use that PdumBase offers, we are confident that this work will provide a reliable resource to the community for transcriptome studies due to its extensive content and user friendly design.Back to top